Your log
Dashboard
Your totals, countries, streak and activity, across all of your logbooks.
The dashboard shows statistics for every contact in every logbook. To open it, select Dashboard in the navigation bar. It operates offline.
Fieldbook
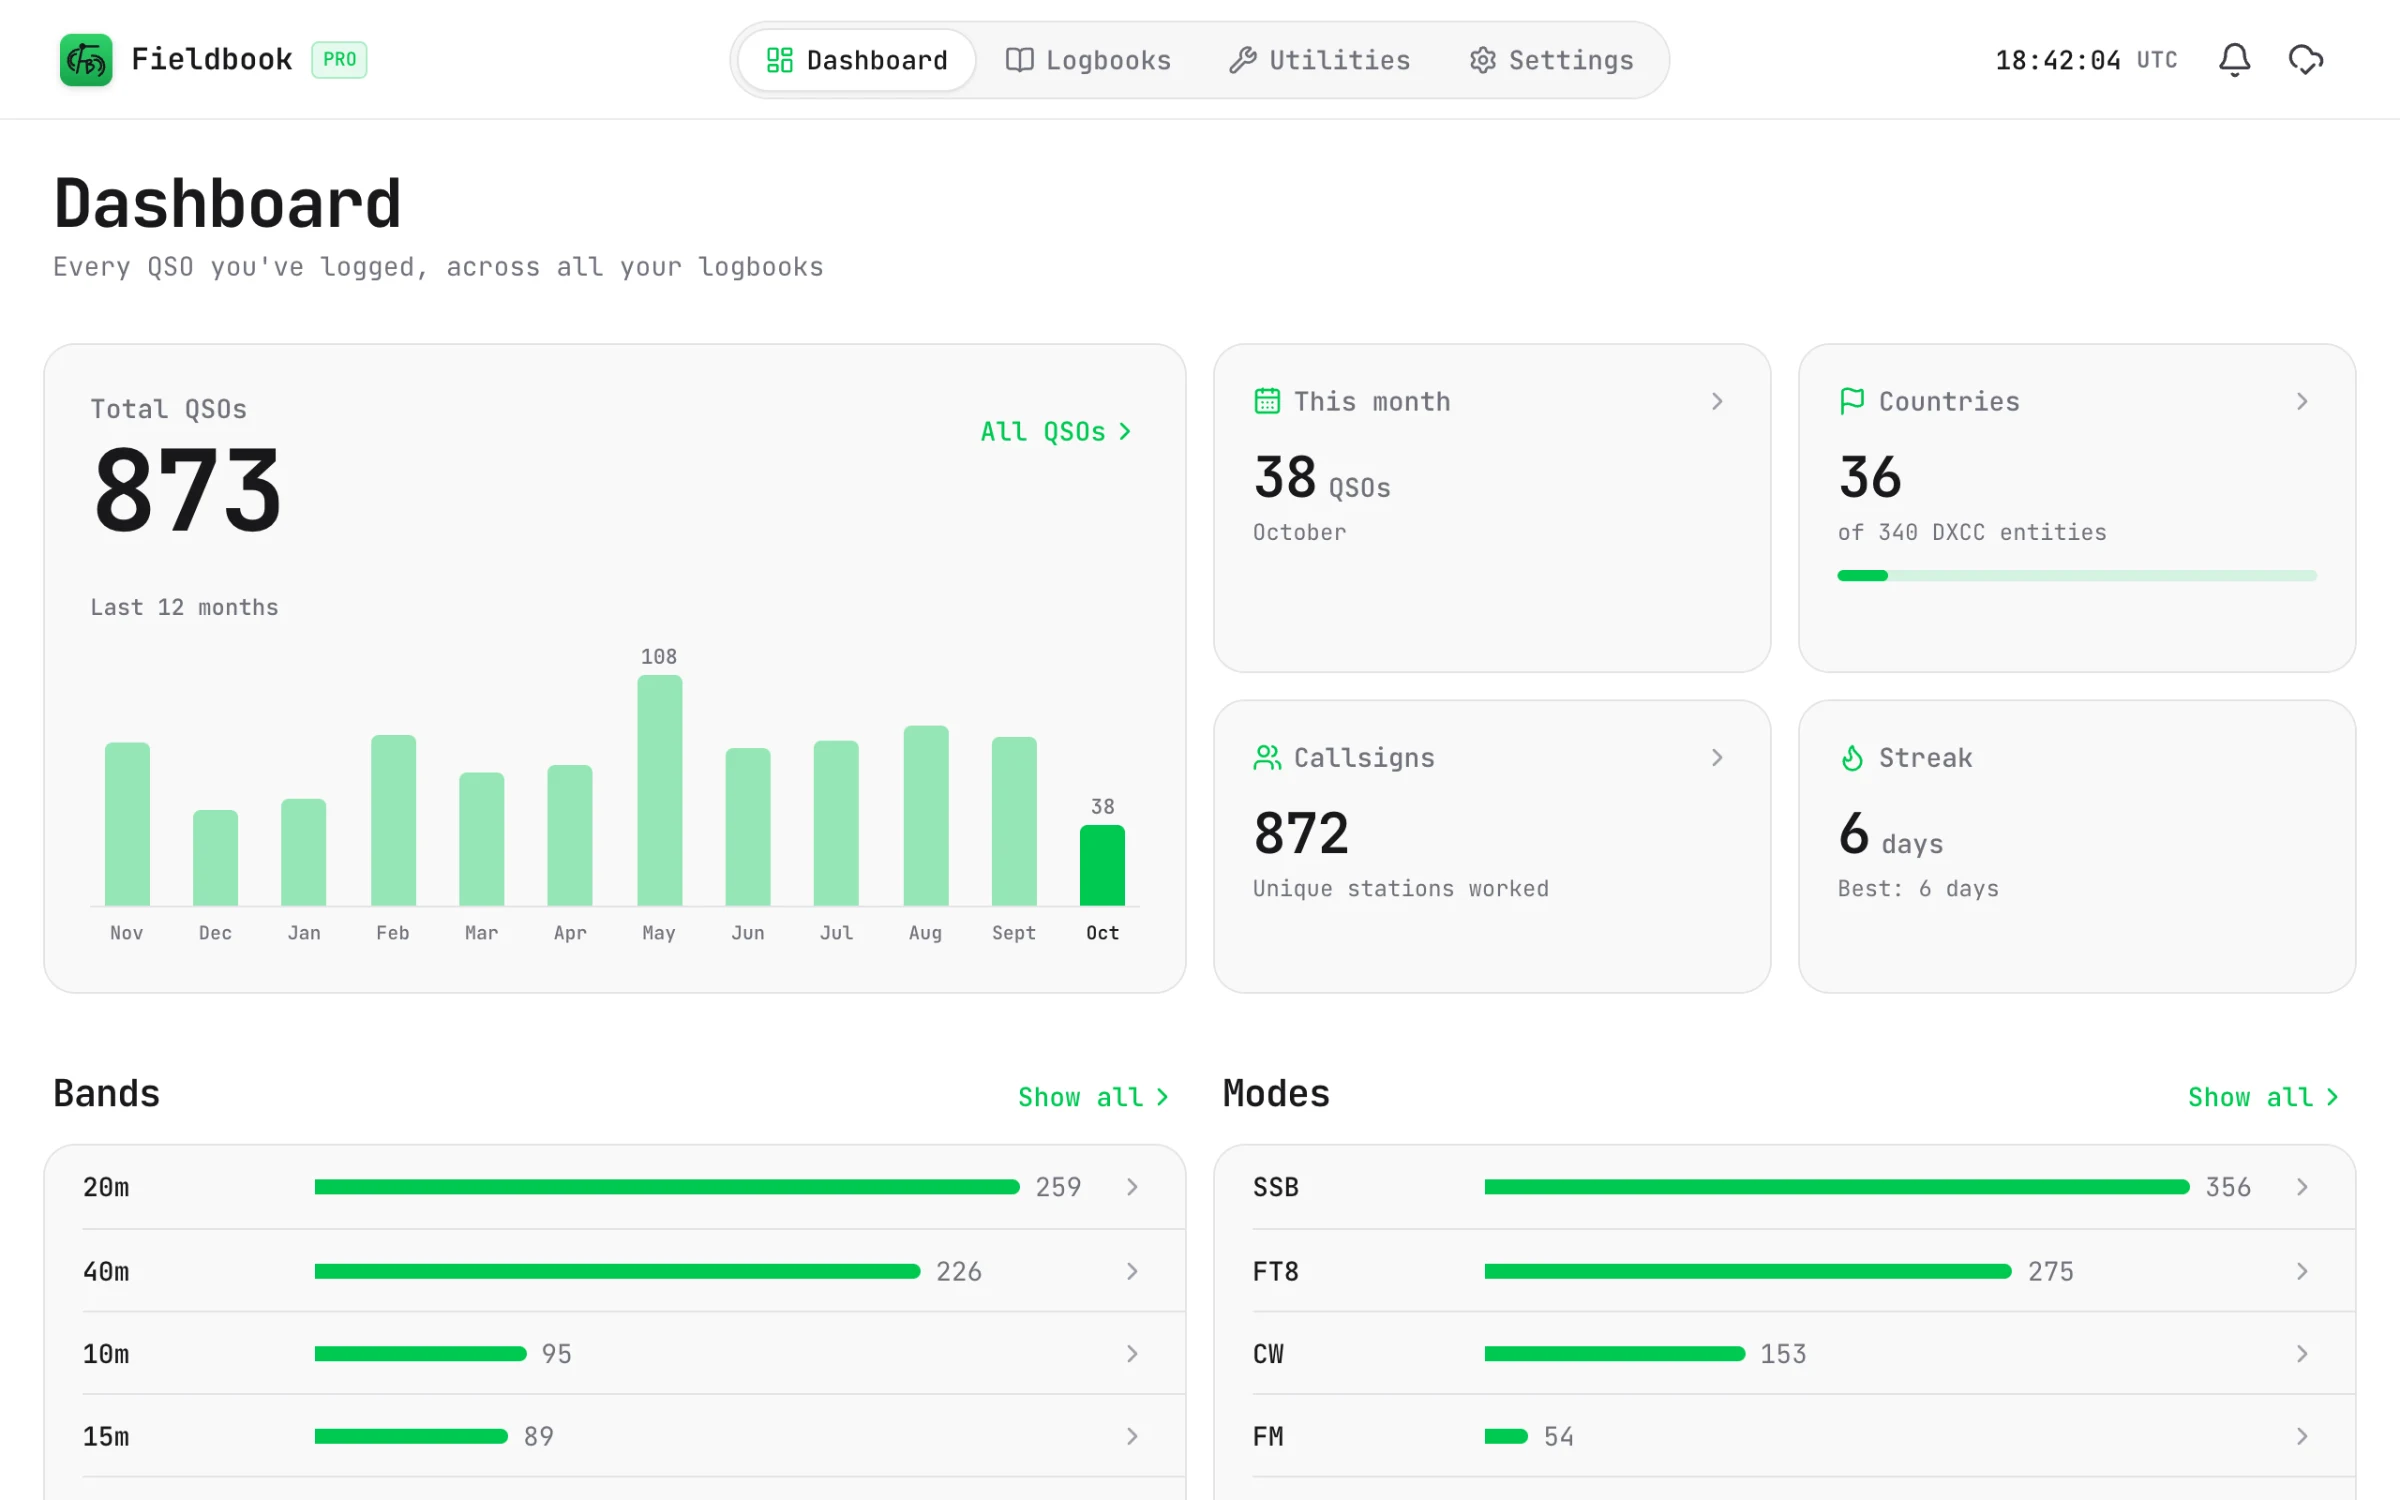
What the dashboard shows
- Total QSOs: every contact that you have logged.
- Last 12 months: a chart of your contacts each month.
- This month: your contacts in the current month.
- Countries: the number of DXCC entities that you have worked, out of 340.
- Callsigns: the number of different stations that you have worked.
- Streak: the number of days in a row with one or more contacts, and your best streak. Days are in UTC.
- Bands and Modes: your contacts on each band and in each mode.
- Map: a preview of every contact on a map. Refer to QSO map.
- Countries: the countries that you have worked, with flags.
- All contacts: every contact, from all of your logbooks.
Breakdowns (Pro)
With Pro, you can open each statistic for more detail. Select a card, or select Show all beside a list. You can see your contacts by:
- Band
- Mode
- Country
- Callsign
- Month
Select a row in a breakdown to see the contacts in it.
Fieldbook
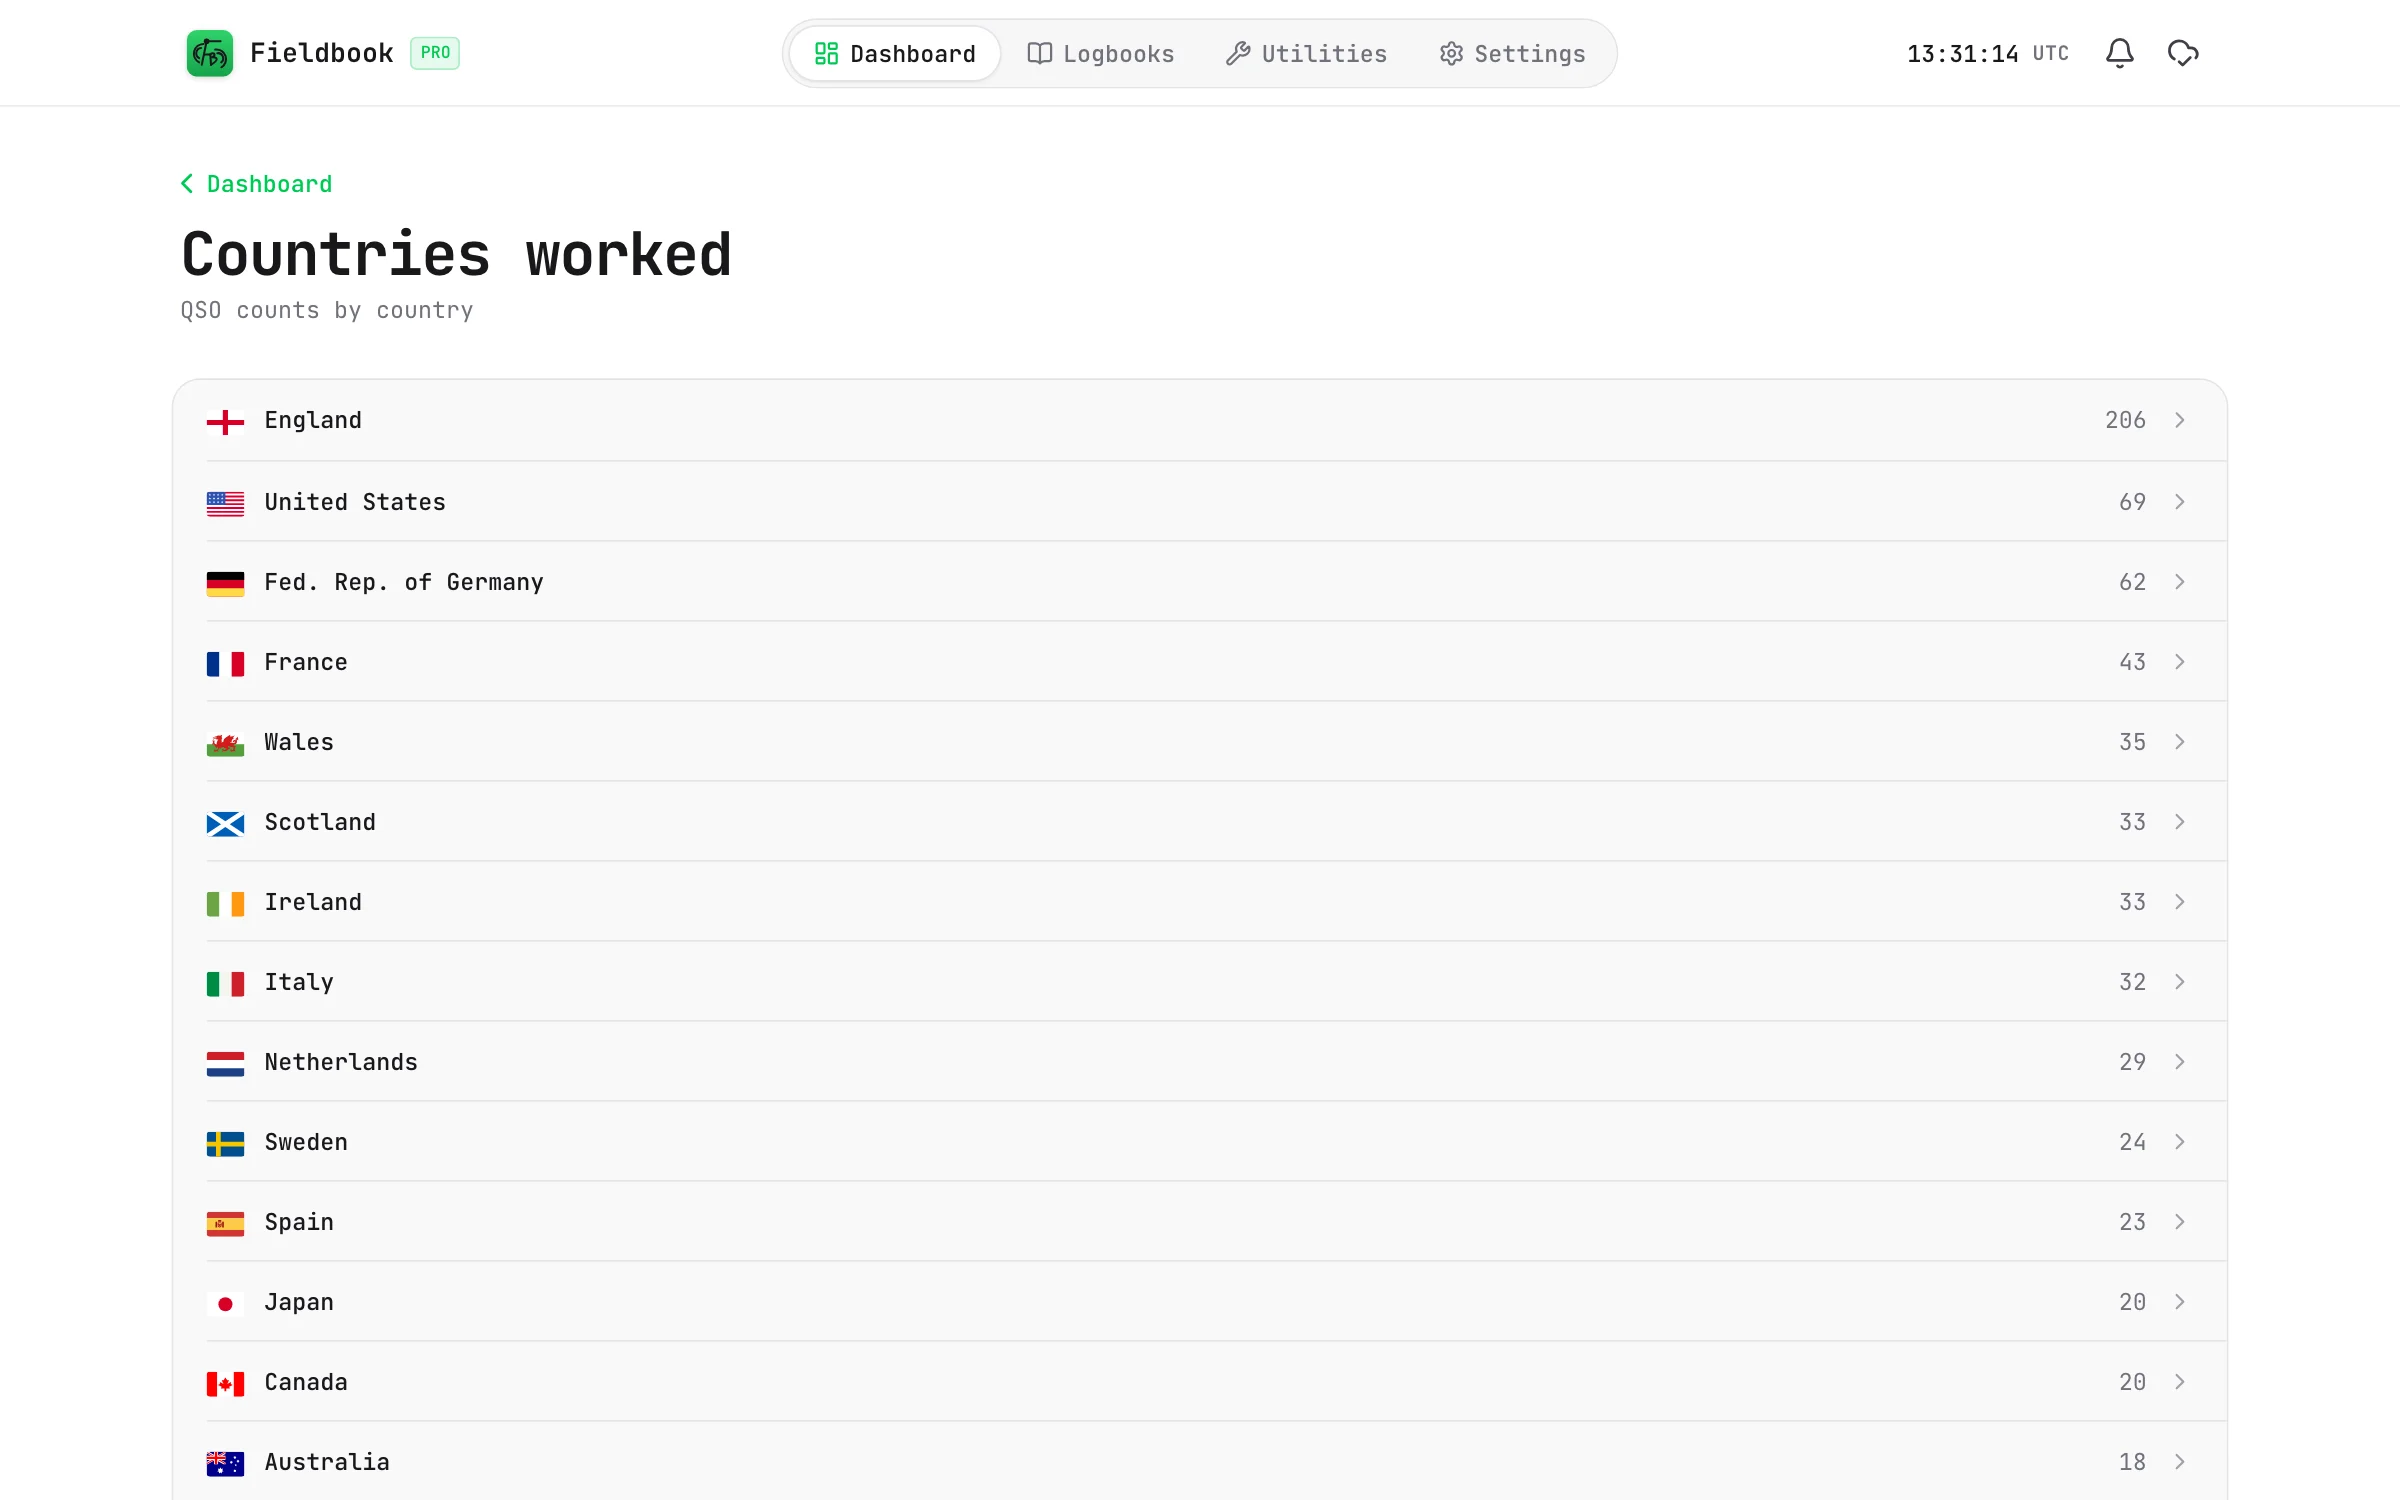
Countries come from the callsign, through the BigCTY country data. If the countries do not show, go to Settings > Offline Data and download the BigCTY data.